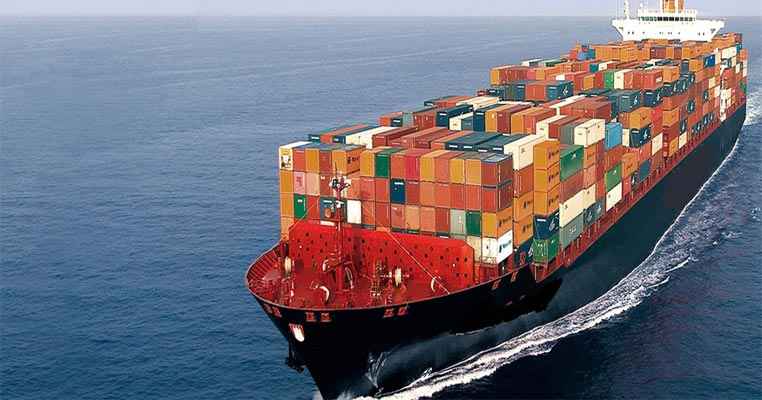
Global freight volumes showed signs of a downfall
Posted on May 8, 2023 |
In early 2023, global freight volumes saw the fastest decline in 3 decades but showed signs of deceleration at the end of Q1.
Volumes fell by 2.1% between December-February 2022 compared with the same period in 2021.
In February, the US rail network moved 1.06 million containers, the lowest since 2015 and before 2012, showing a global slowdown.
Excess inventories affected global freight along the supply chain as consumer and business spending regressed from merchandise to services after the pandemic.
Inflation, rising interest rates, and increased worries of an upcoming recession also prompted households and firms to be more careful about spending.
In March, the port of Singapore’s container throughput soared to a record high of 3.34 million twenty-foot equivalent units (TEUs).
In the same period, in China, freight movements also soared to a seasonal record of 2,022 billion ton-kilometers because industries returned to production after lockdowns upset and the pandemic’s exit wave.
At London’s Heathrow Airport, cargo volumes fell by 9% compared to the same month a year earlier, but volumes have steadied since Q4.
In the US, the number of shipping containers handled via the 9 biggest ports fell by 22% but was in line with the pre-pandemic average for 2015-2019.
The cost of containerized ocean shipping saw a slight increase in recent weeks after falling constantly for a year.